Using definitions of technology from Kline and the idea of Technogenesis, analyze data collection and analysis as a technology in its relationship to and effect on culture.
Personally I find the statistics from web user analysis fascinating. The increase in companies using data collection and the growing invasiveness of the data collected does impact how people interact with media, or at least has made people more aware of what is actually happening when they interact with media online.
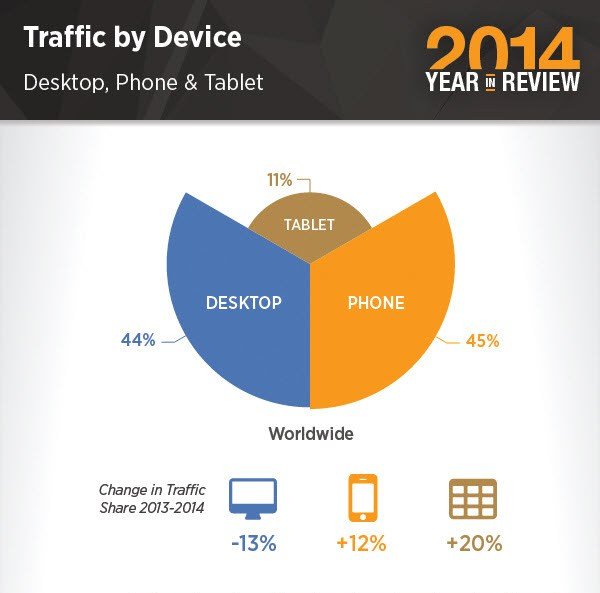
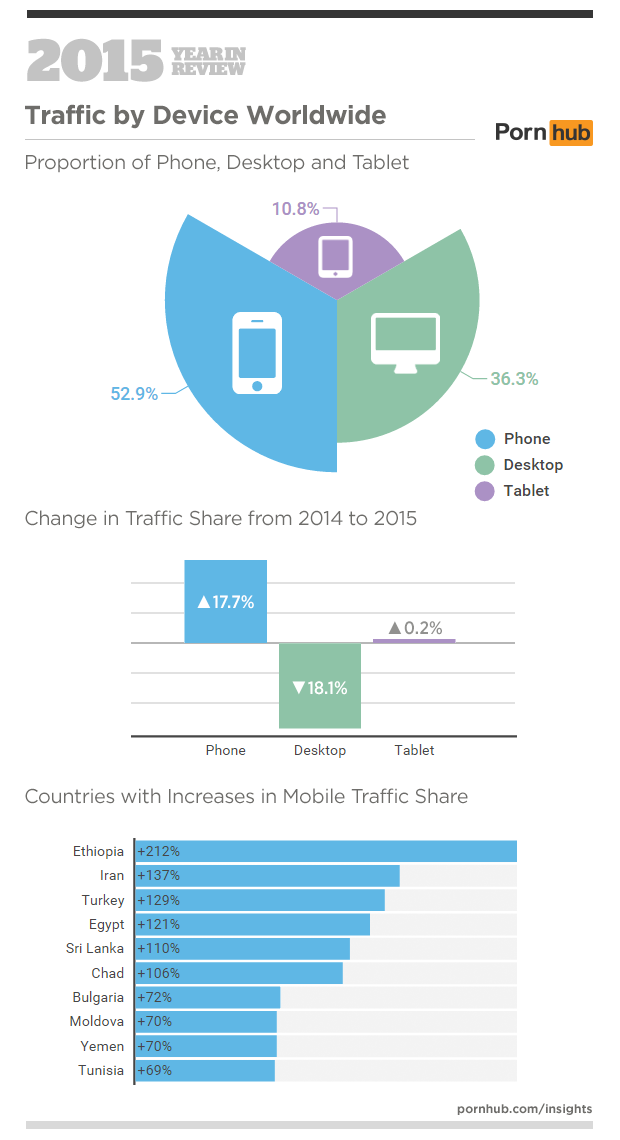
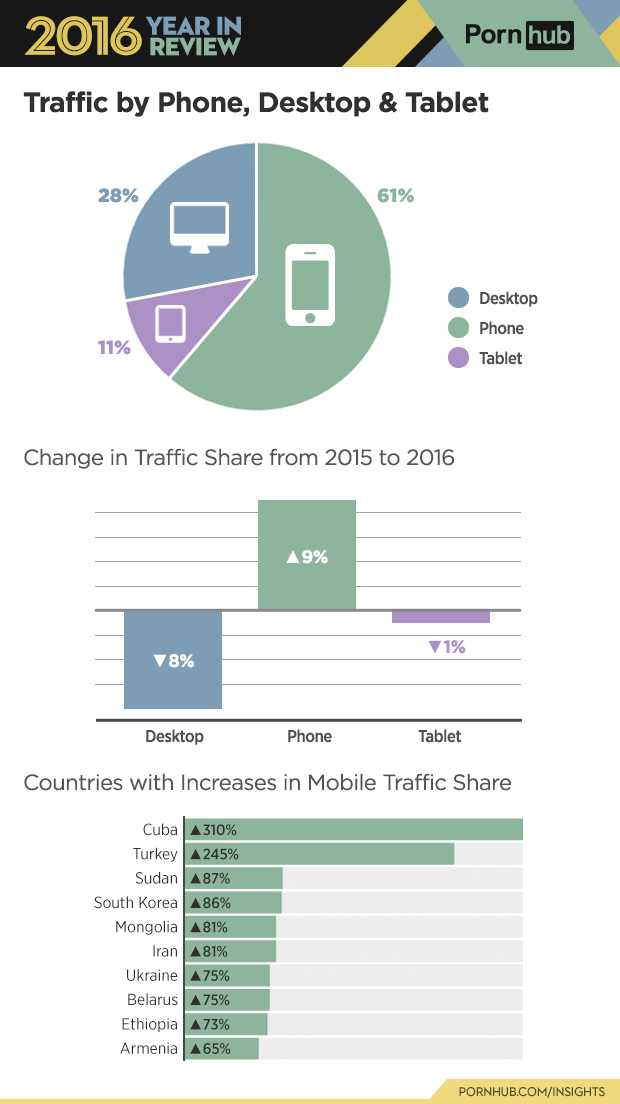
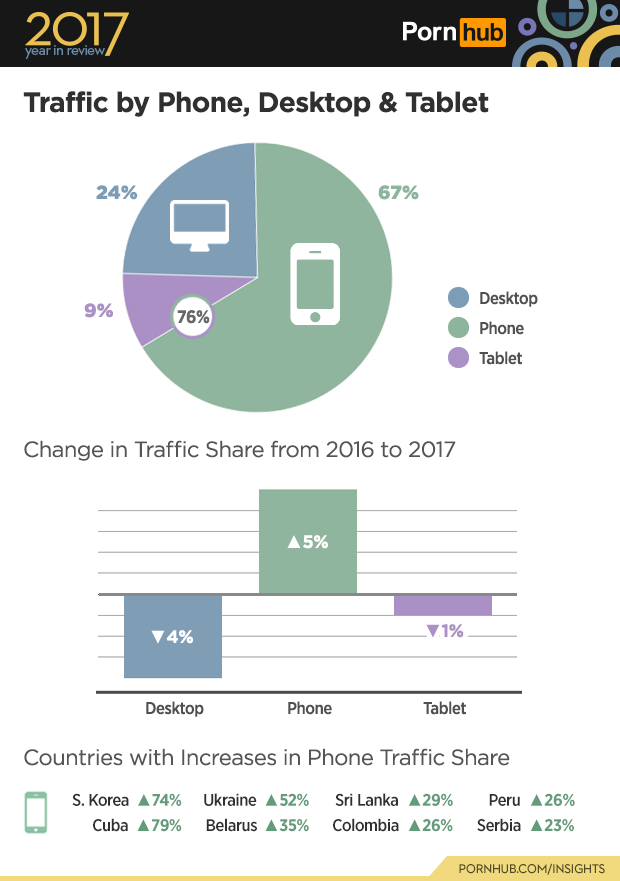
Here’s the thing, I know that these companies are using this information in possibly (definitely) nefarious ways, BUT looking at the data gives so many insights to how culture is shifting relative to tech trends. According to yearly analytics from from pornhub.com, in 2014 there was a 12% increase in access to the site via mobile phone; 2015 – 17.7%; 2016 – 9%; 2017 – 5%. Interesting to note that desktop usage went down in tandem. Mobile phone usage eclipsing desktop users is an excellent example of how culture is changing tech trends.
Another interesting stat is the increase in mobile device usage in Cuba, showing the biggest increase in 2016, note, around that time, the US embargo on Cuba was easing up and relations were improving. This also correlates with the government’s (Cuba) National Office of Statistics and Information, which also showed an increase in digital access around this time. This type of data collection can show us worldwide trends and in Cuba’s case the immediate effects of foreign policy.
Modern data collection is an example of a technology shaping culture, it not only influences how we access and view media but it can also show us universal trends and cultural shifts. The device traffic data is only a small part of the data that is released every yearAs we know this is extremely important information in advertising. Technology changing advertising strategy is actually another example of technogenesis. Technology changing the way that advertisers market and how consumers view ads, changes consumer patterns, which in turn changes how advertisers market.
According to a study done in January 2018 by the Pew Research Center, Facebook, Instagram, and Youtube are the most heavily trafficked social media sites by 18-29 year olds. While this shows the amount of people who have an account and use the app, the information is important is the amount of DAILY users. When it comes to advertising, you don’t want to spend your money on sites if the people you want to see and ad won’t. So when it comes to advertising to 18-29 demographic, it is most relevant to spend money on Instagram, Youtube, and Snapchat. Money for the 50-64 group is best spent on Facebook and Twitter, based on daily user data. This type of data of course goes deeper than age demographics; retention rates, searches, clicks, and hundreds of other factors are also logged. If any of these trends shift, if for some reason Snapchat becomes the next hot thing for the 64+ age demo, you can expect a shift in advertising strategy.
